How Graphs Help Explain Motion, Force and Energy in Physics
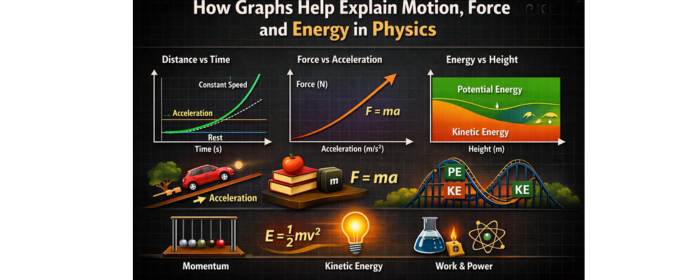
A single squiggly line can tell you more about a falling mango than three paragraphs ever could, and that is exactly why physics refuses to let go of graphs. Yes, you heard that right! In physics, graphs have the prowess to turn invisible ideas like speed, force, and stored energy into shapes that you can actually see and measure, and that’s how they explain different concepts that would otherwise be daunting to see clearly.
Anyone who has sat through a physics tuition in Singapore will tell you that the moment they understand a graph, the whole topic stops feeling abstract, and we are here to talk all about it. Wondering why graphs are important in Physics and how you can use them to your advantage? Read on to find out!
Why Gradient Matters More Than Speed Itself
On a position-time graph, the object’s actual speed is secondary to the gradient of the line. While a steep gradient indicates rapid motion, a horizontal line indicates that the object is stationary, and a curve indicates that acceleration is present. If this sounds too confusing for you, or you are finding it difficult to apply this concept, feel free to seek help from a tutor at Sec-3 physics tuition to understand at which stage kinematics shifts from a purely descriptive exercise to one requiring careful graphical interpretation.
What Does a Force Graph Reveal that a Description Cannot?
In problems concerning force, a frequently overlooked example includes vehicle crumple zones. Their function isn’t to reduce the force of impact by softness alone, but to extend the duration over which the force acts. On a force-time graph, this is represented by the area under the curve, which is otherwise known as impulse.
How Can an Energy Graph be Helpful?
A force-extension graph for a spring hides work done as the triangular area beneath it, and watching that area grow as you stretch a spring further is oddly addictive once you know what you are looking at.
Graph Type |
Axes |
What It Reveals? |
| Position-time | Distance v/s time | Gradient = velocity |
| Velocity-time | Speed v/s time | Area = distance, gradient = acceleration |
| Force-extension | Force v/s extension | Area = elastic potential energy |
Where Does the Difficulty Increase?
The complexity of the graphs in physics increases with the introduction of concepts like exponential decay curves and simple harmonic motion graphs, where the shape of the curve itself encodes the underlying equation. This is where a little help from H2 Physics Tuition in Singapore can help as they improve students to interpret graphs with the same fluency that they apply to written explanations.
Conclusion
Graphical fluency is not a peripheral skill in physics; it is central to how the subject is examined, applied, and understood at every level. From the gradients that define motion to the areas that quantify impulse and stored energy, graphs provide the clearest available link between intricate physical principles and measurable outcomes. Wondering how to interpret graphs in Physics?
Or looking for a seasoned A-level physics tuition for your understanding graphs? Contact our team at Best Physics Tuition™ today!